Inflation reports measure how the prices of a fixed set of goods and services change over time, usually expressed as a percentage change from a year earlier. They track the average price movement for typical household spending, not the experience of any one person. Here is what the headline number covers, and what it does not.
What inflation actually is
Inflation is a general rise in prices across the economy, which means each unit of money buys a little less than before. It is not the same as one item getting more expensive. If only eggs cost more, that is a price change; if prices broadly rise, that is inflation.
Statistical agencies measure it with a price index. In the United States, the Bureau of Labor Statistics publishes the Consumer Price Index, or CPI, each month. In the United Kingdom, the Office for National Statistics publishes a similar measure, also called CPI.
The “basket” idea
Imagine a shopping basket that holds what a typical household buys: food, rent, fuel, clothing, transport, health care, entertainment, and more. Statisticians price that basket regularly and compare today’s cost with the cost in an earlier period. If the basket costs 3 percent more than a year ago, the annual inflation rate is 3 percent.
The items are weighted by how much households spend on them. A large expense like housing counts for more than a small one like greeting cards.
Where the prices come from
Data collectors gather prices from stores, service providers, and online sources, and some figures come from surveys of household spending. Agencies also adjust for changes in quality, so a better product at a higher price is not counted as a pure price rise.
Headline versus core
You will often see two numbers in the news. The headline figure covers everything in the basket. The core figure leaves out food and energy, which tend to move up and down sharply and can hide the underlying trend.
| Measure | What it includes | Why people watch it |
|---|---|---|
| Headline inflation | All items in the basket | Shows overall price change |
| Core inflation | Excludes food and energy | Shows the steadier trend |
| Monthly change | Change from the previous month | Shows recent momentum |
| Annual change | Change from the same month last year | The figure most often quoted |
Common misunderstandings
The most frequent one: when inflation falls from 4 percent to 3 percent, prices are not going down. They are still rising, only more slowly. Prices actually falling is called deflation, which is a different thing.
- It is an average. Your own inflation depends on what you buy. Someone who spends heavily on fuel or rent may feel it differently from the headline.
- It does not measure wages. Whether your income keeps pace is a separate comparison.
- It is not a single price. It blends thousands of prices into one figure.
Why inflation reports matter
Central banks watch inflation closely when deciding how to set interest rates. Governments use price indexes to adjust some benefits and thresholds. Businesses watch them when planning budgets and setting prices, a topic we cover in small business pricing basics.
Reading a report sensibly
When a new report appears, look for the period it covers, whether the figure is monthly or annual, and whether it is headline or core. Be aware that estimates can be revised later. Coverage that mentions only one number without these details is worth treating cautiously, and the habits in our guide to reading a news story apply here just as well.
Numbers also get repeated and distorted online, so it helps to trace a figure back to the agency that published it, as described in how to spot misinformation. More explainers like this live in the News category.
This article is general information, not financial advice. For decisions about your own money, consult a qualified professional.
Key takeaways
- Inflation reports track the average change in prices of a basket of goods and services.
- Headline includes everything; core excludes food and energy.
- Slower inflation means prices rise more slowly, not that they fall.
- The figure is an average and may not match your own spending.
- Check whether a number is monthly or annual.
Frequently asked questions
What is the difference between CPI and inflation?
Inflation is the general rise in prices. The Consumer Price Index is one tool for measuring it, based on a basket of consumer goods and services.
Why is core inflation used?
Food and energy prices swing a lot from month to month, so removing them can reveal the underlying trend more clearly.
If inflation drops, will prices go back down?
Not usually. A lower inflation rate means prices are rising more slowly. Prices falling across the economy is deflation.
Why does my own cost of living feel different from the reported figure?
The index reflects an average household. Your spending mix, such as housing, fuel, or food, may differ, so your personal experience can be higher or lower.
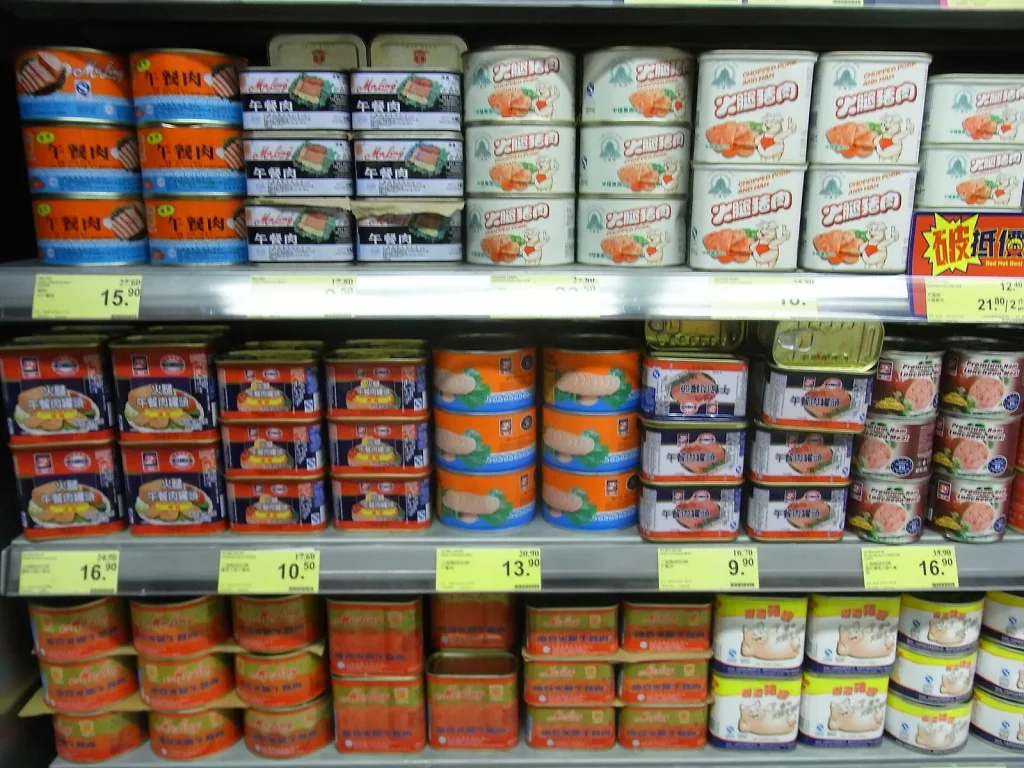
Photo: HK Parkn Shop Supermarket Chinese Luncheon Meat Sept-2012 by Teamie870268, CC BY-SA 3.0, via Wikimedia Commons